Customizing PowerBI report in Power Apps Portal
Help UKRAINE
 ! Your action matters! Donate
to support Ukrainian Army! Donate to charity funds!
Organize/join street protests in your city to support Ukraine and condemn Russian aggression!
Expose and report Russian disinformation! #StandWithUkraine
! Your action matters! Donate
to support Ukrainian Army! Donate to charity funds!
Organize/join street protests in your city to support Ukraine and condemn Russian aggression!
Expose and report Russian disinformation! #StandWithUkraine Embedding PowerBI reports into the dashboard is a powerful feature. It allows sharing stunning PowerBI visuals without the hustle and complex configuration. However, there still commons issues like how to style report on the portal, etc. Below you will find answers on some common problems and issues that I faced. I will not go into details on how to configure Power BI visualization and how to embed report to the page - you can find answers for those questions here in the official documentation.
Height and width of Power BI report
One of the most common questions is how to change the default height and width of the Power BI report. If we inspect the page we can find that report is embedded in the div element with class powerbi. This CSS class looks like this:
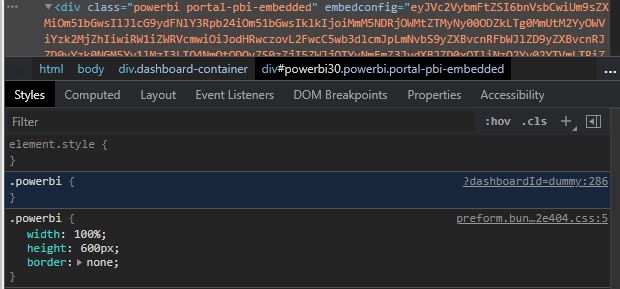
As you can see it restricts the height of the element to 600 px by default. So to make our report taller in the template of the page (or in CSS settings) we need to write next line:
.powerbi {
    /* provide necessary height */
    height: 85vh;
}
You can also add !important modifier to make sure that this class will not be overwritten. Similarly, you can change the width of the report.
powerbi-client javascript library
When you enable support for powerbi MS also includes the powerbi-client library to the page that allows you to update report settings and handle events. Below we will take a look at a couple of interesting usage scenarios. You can find more about this library in the official documentation here.
Be aware that portals ships with powerbi-client version 2.6.5 - which is a pretty dated version. So while reading docs always check starting from which version they added support for the feature you are interested in.
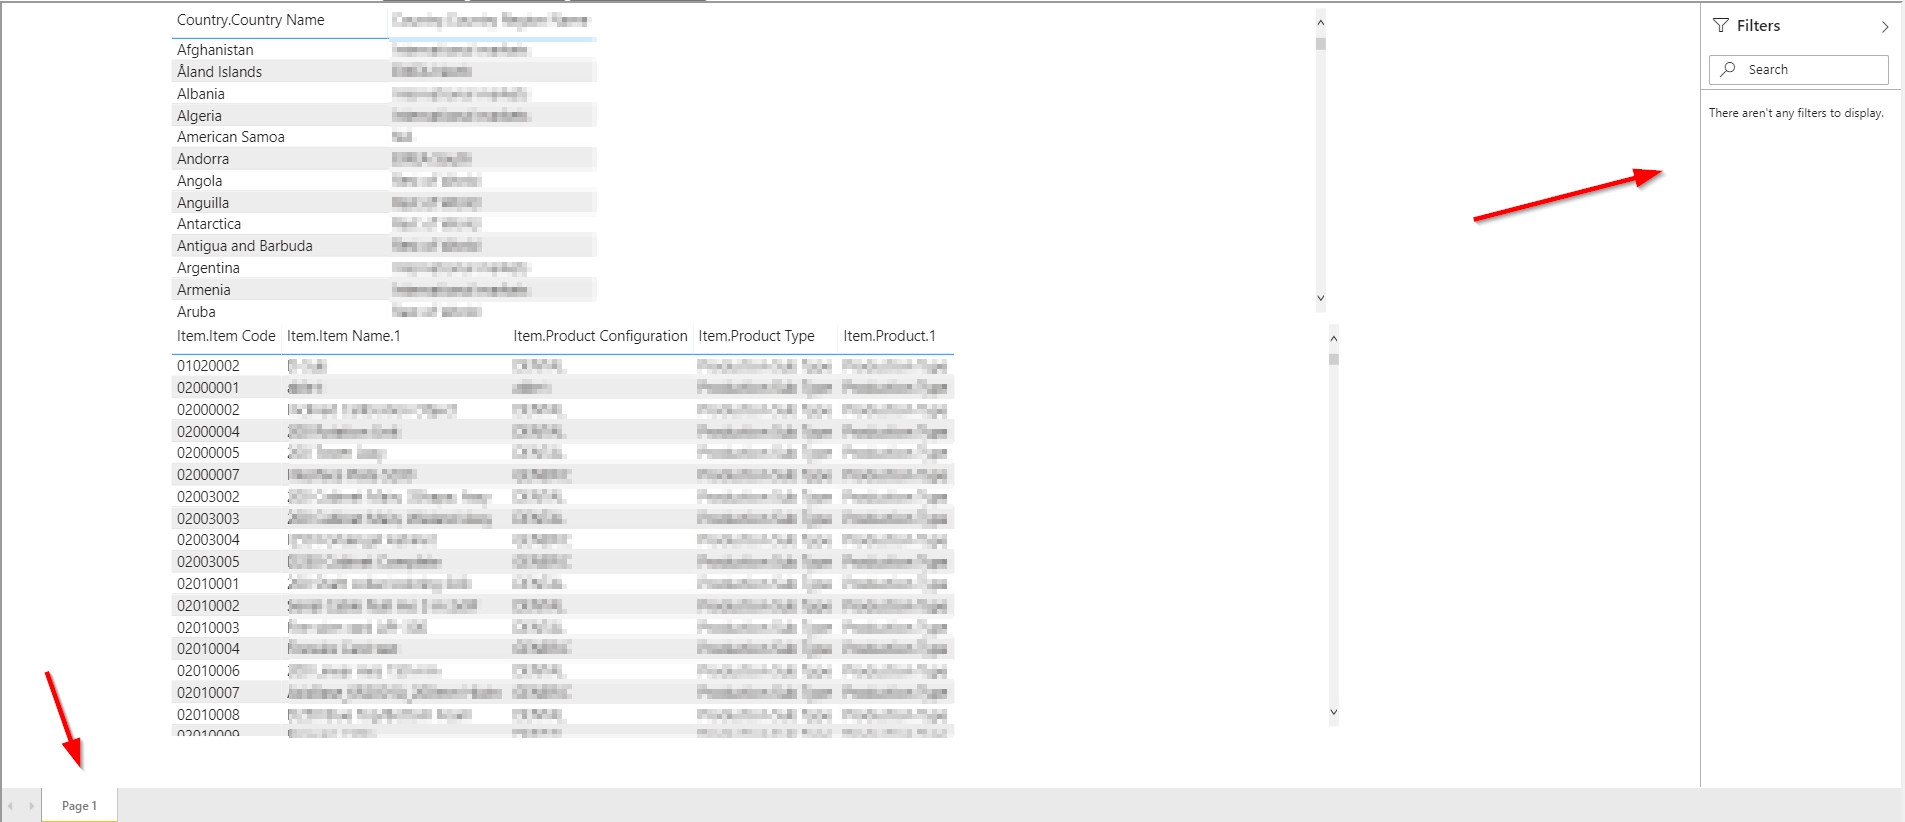
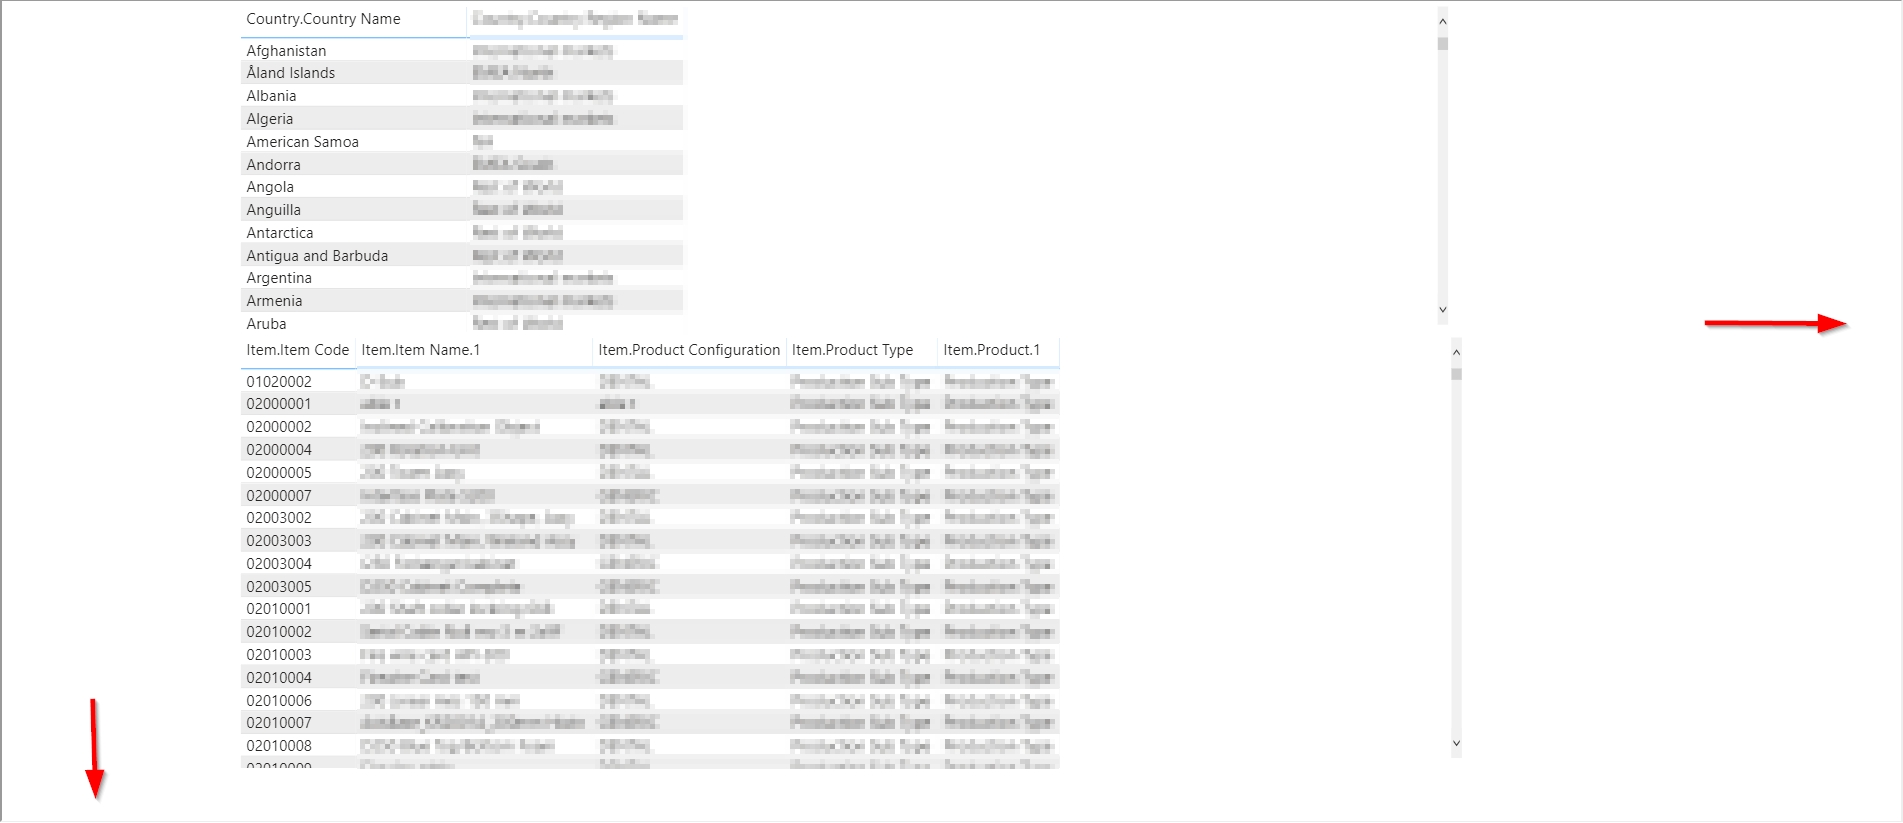
Removing filters and navigation
Default navigation in report and filtering are both really nice features. However sometimes, especially when the report contains only one page and doesn’t have anything to filter those features just take up space on the screen. Using power-client we can update report settings to disable/enable those features. Check below code for details
$(window).load(function() {
    // get div container for powerbi report
    var embedContainer = $(".powerbi")[0];

    // get reference to the embedded report
    var report = powerbi.get(embedContainer);

    // register a function to execute when report will finish loading
    report.on("loaded", function(){
        // update existing setting of the reports
        // you can disable only one page or both at the same time
        report.updateSettings({
            panes: {
                filters :{
                    visible: false
                },
                pageNavigation:{
                    visible: false
                }
            }
        }).catch(function (errors) {
            console.log(errors);
        });
    })
});In this example, I am using window.load instead of more frequent document.ready (that can be found in the official documentation here). This is because sometimes powerbi report wouldn’t load when document ready event would be fired, thus making code unusable. Using window.load ensures that the page is fully loaded first.
With filter and navigation panes:
Without filter and navigation panes:
Fullscreen
Next scenario that we will cover is opening your report fullscreen. This is particularly useful for big reports with a lot of visuals or in general to have a better overview of data.
// get div container for powerbi report
var embedContainer = $(".powerbi")[0];
// get reference to the embedded report
var report = powerbi.get(embedContainer);
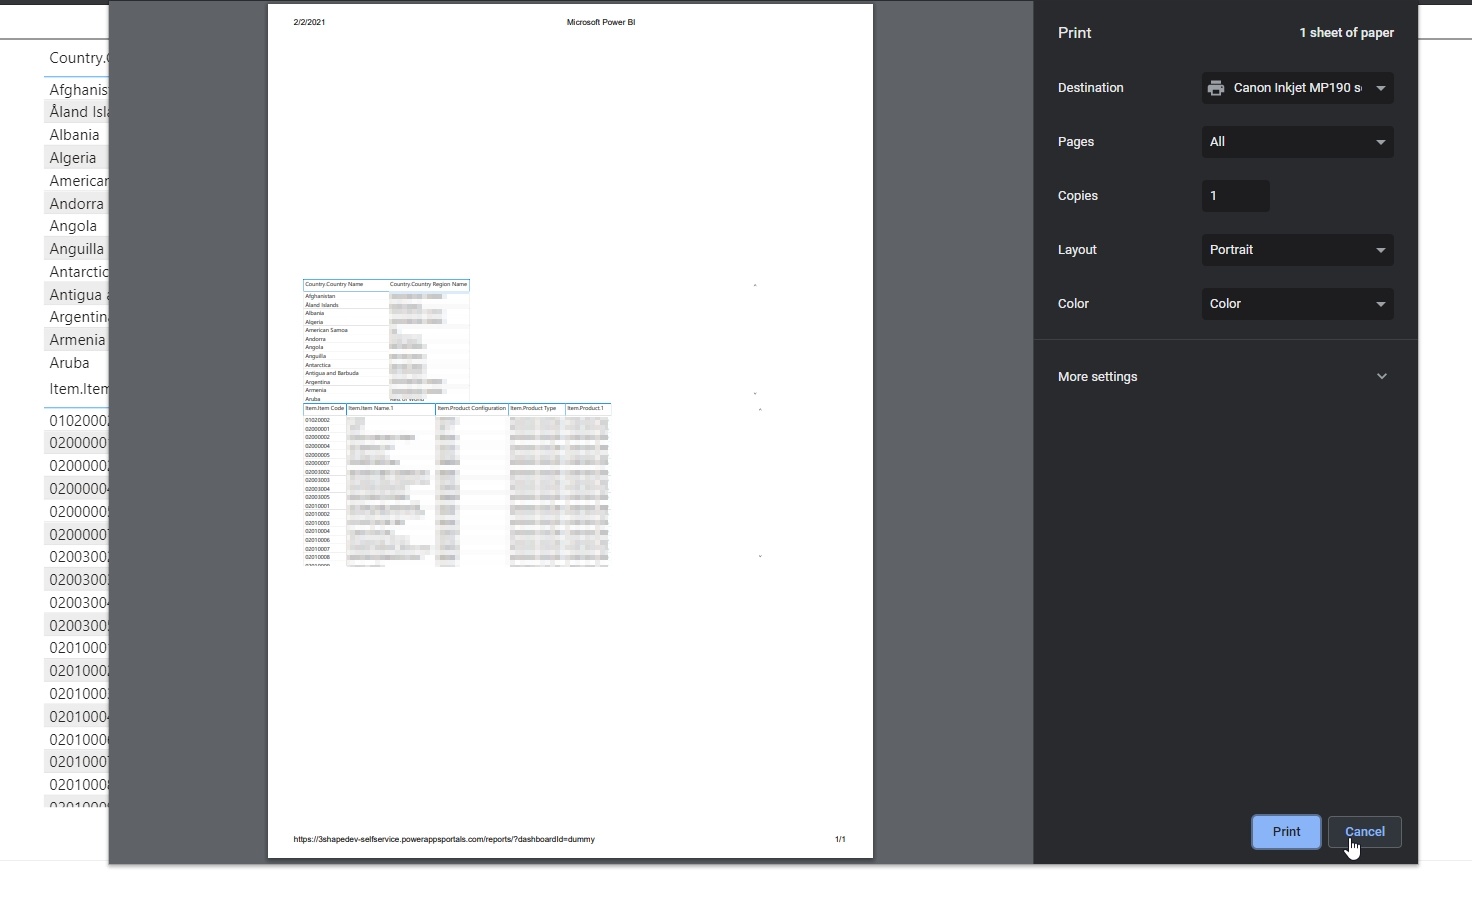
report.fullscreen();Print report
Sometimes we need to print generated report and we don’t want to print the whole page with it. powerbi-client library got us covered
// get div container for powerbi report
var embedContainer = $(".powerbi")[0];

// get reference to the embedded report
var report = powerbi.get(embedContainer);

report.print()
    .catch(error = > { console.error(error); });
Print report dialog:
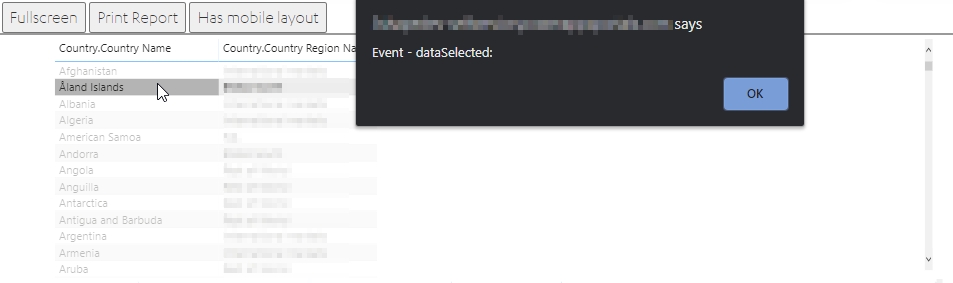
Data selected event
Sometimes we need to handle events in a specific way - show notification when the data was selected etc. Luckily we can register custom event listeners on data selected event and perform our custom logic.
// get div container for powerbi report
var embedContainer = $(".powerbi")[0];

// get reference to the embedded report
var report = powerbi.get(embedContainer);

//Report.off removes a given event listener if it exists
report.off("dataSelected");
//Report.on will add an event list
report.on('dataSelected', function(event){
    console.log('Event - dataSelected:');
    console.log(event.detail);
})
Show alert on data click:
Conclusion
PowerBI embedding is a powerful feature of Power Apps Portal that allows easily configure and share complex and beautiful visuals. powerbi-client library allows us to perform more complicated configuration of the reports to fit our needs. I hope that MS will soon update the version of the library used in the portal which will allow us to have even more control over the embedded report.